
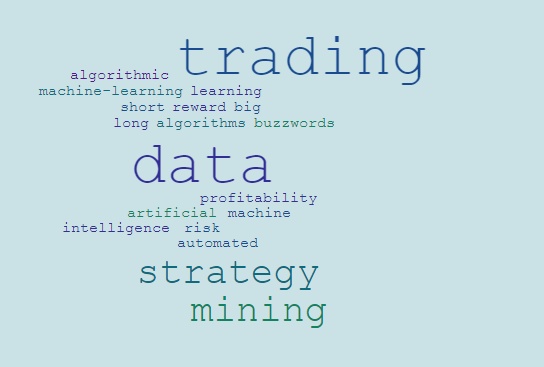
Artificial intelligence, machine learning, data mining and big data seem to get thrown around in everything from business intelligence to financial services.
Artificial intelligence is used where machine learning should be and machine learning is often confused with data mining. The goal of this post is to clarify these buzzwords, explore how they apply to trading and then explore an ideal subcategory of data mining for traders.
Artificial intelligence, a subfield of computer science, has three main subcategories; machine learning, curated knowledge and reverse engineering the brain. Machine learning is a method of developing algorithms for recognizing patterns within data. Data mining, also a subfield of computer science, is the whole information discovery process; from preparing and cleaning data to analyzing to post processing and visualizing your results. Data mining uses techniques developed in machine learning, i.e. machine-learning algorithms, and statistics. Here is a diagram of the big picture:

The reason why big data gets thrown into the mix is because data mining and machine learning often involves large and/or complex data sets where traditional data management and processing tools won�t work. For example, if you wanted to capture, curate, store, and analyze blog posts over the past 10 years for a sentimental indicator, traditional data management and processing tools probably wouldn�t cut it.
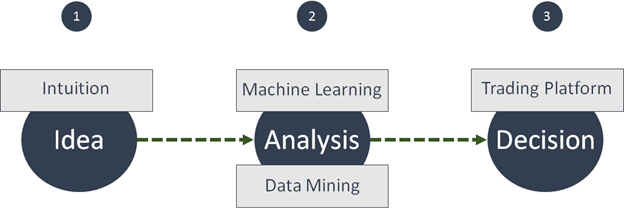
When I make an investment decision I go through 3 steps.

If we could improve any one of these three steps, we could improve our investment decision. Step 1 is really up to you; there is no substitute for your intuition. Improving your order execution, in step 3, unless you are in the HF space or you need to break your orders down to minimize the impact in the market, is not going to improve the performance of your trade. Step 2, the analysis step, is where we can make the biggest impact. How can we make our analysis as good as possible? This is where the buzzwords come in.
In short, a machine-learning algorithm is better than you or me in analyzing data and discovering valuable information. Instead of scrolling through charts and creating pivot tables in Excel, we can use a machine-learning algorithm to do the work for us.
Let's say I have an intuition that GOOG's PEG ratio, the MACD and StockTwit sentiment have a relationship to Google's stock price. I could spend a lot of time analyzing that data myself or I can use an algorithm developed in machine learning to mine for patterns for me. These algorithms (decision trees, support vector machines, Naive Bayes classifiers, etc.) uncover the relationship between the indicators I want to analyze and their affect on GOOG's stock price. The results from the algorithm's analysis are objective and mathematically supported. Here is a step-by-step tutorial in R using a Naive Bayes algorithm and a few technical indicators to predict the price of AAPL. You can download R for free and copy and paste the code to do it yourself! It will give you a good understanding of the overarching concepts and general process.
One of the main reasons why these technologies are taking time to trickle down to the individual investor is because the results are difficult to interpret. For example, it is difficult to translate beta coefficients, decision matrices, and probability density functions to actionable trading logic, something that a trader without a background in machine learning or data mining is going to understand and be able to use. This is why I would like to introduce a specific subset of data mining that is perfect for the individual trader.
Data mining is composed of 6 subcategories:
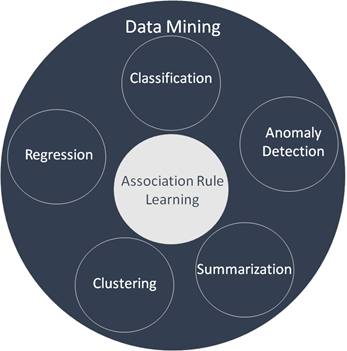
Data mining has a wide application in the financial industry. For example, anomaly detection is used to detect insider trading and fraud and clustering can be used for portfolio optimization and it turns out association rule learning is a perfect fit for traders.
Association rule learning translates the complex output of a machine-learning algorithm into an expressive and human-readable form. You get an objective, mathematically supported analysis that is easy to understand, and most importantly, easy to apply to your own trading. You have also created a one-of-a-kind strategy, presented in a series of "if-then" statements, that is based on your intuition and fine-tuning. For example,
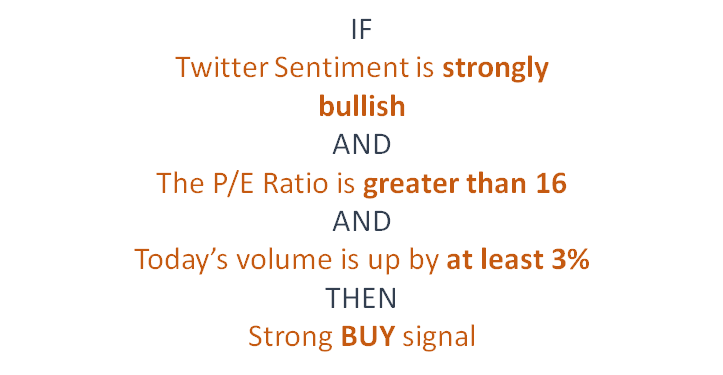
This is why we developed TRAIDE. You use your intuition to select from the inputs you want to analyze; whether it's fundamental, technical, macroeconomic or sentimental indicators. You can then select an asset and timeframe just like you would in your trading platform. TRAIDE will select a machine learning algorithm to data mine your inputs for information and then display the results in interactive charts where you can manipulate the inputs to see how they interact with each other. In other words, TRAIDE shows you the valuable information within your data and displays it to you in interactive charts. You select the indicator values you want for your trading strategy and TRAIDE writes them out in plain english. You can print out the rules, code them yourself, test them over new data, or export a report.
Artificial intelligence, machine learning, data mining, and big data have attracted so much attention recently due to the advantages they can provide to a variety of industries. Within the financial industry, these buzzwords have wide applications. For traders, there is a particular subset of data mining that can be utilized to improve upon our trading. We are used to clear and concise trading rules. We are also used to analyzing charts and row-after-row in Excel. To get the analytical capabilities within data mining and machine learning with a clear set of rules as the output, we can utilize association rule learning.
With TRAIDE, you are able to combine your intuitions with machine-learning algorithms, and through a visual, interactive analytics dashboard, leverage the full benefits of association rule learning. We are really excited for you to get your hands dirty in trade and see some of the strategies that you can uncover. If you sign up on our website, you'll get two weeks of full-featured use when we launch.