

Data science is becoming more and more accessible to more and more people.
Amazon launched Amazon Machine Learning last month, Microsoft Azure has been available for some time now and IBM is pushing to commercialize Watson more than ever before. While there is a lot of hype surrounding some of the hot topics in data science, there is a good reason some of the largest firms are investing in the technology to make it more accessible.
Data science and machine learning seem to be just about everywhere in the trading world. And for good reason! The goal of data science and machine learning is to build a strategy that will perform well on new data, which is exactly our goal as traders. It makes sense to borrow techniques and tools from the data science and machine learning world to make creating trading systems easier.
Using machine learning is not as complicated as it sounds. In fact, the process of using machine learning for a data scientist is very similar to the process of creating a strategy for a trader.
The only difference is a data scientist is going to use an algorithm to uncover the patterns in the data for them. This takes advantage of machines and their capacity for crunching and storing numbers.
Applying data science techniques and machine learning to trading doesn’t really create any new problems for a trader, but it does amplify the problems we already have. There are two in particular that traders should pay special attention to:
The most important aspect of data science and trading is evaluation. Generally, when using machine learning in trading, we feed a dataset into an algorithm to analyze it for patterns. This is called supervised learning. The algorithm “learns” information and discovers any patterns that might exist in the data. As traders, we want to exploit those patterns for profit.
The problem we run into is that our model may lack generalization, or it may overfit to the dataset that you trained it over. This is equivalent to memorizing the answers instead of learning the material. If you want your performance on new data to be similar to your performance on the data over which you trained your algorithm, you need to evaluate your model over new and unseen datasets.
This means doing a lot of out-of-sample testing. There are three ways to do this:
Lucky for us, our industry is jampacked with resources that make out-of-sample testing easier:
When building a strategy, you always want to evaluate it on unseen data. If you are applying machine learning to do the heavy lifting for you, you want to make sure you are following good-practice techniques and evaluate your strategy on enough new data.
Garbage in, garbage out. This is a mantra to live by. If you build your model by training over indicators and features that do not contain any information, you are going to get a model that is not going to perform well on new data, no matter how great it looked on the training set. This makes feature selection one of the most important aspects of data science.
In machine learning, the inputs are commonly referred to as features. Features are commonly confused with indicators in trading, but there is a difference. Indicators can include many features and indicators can be features themselves. Here is what I mean:
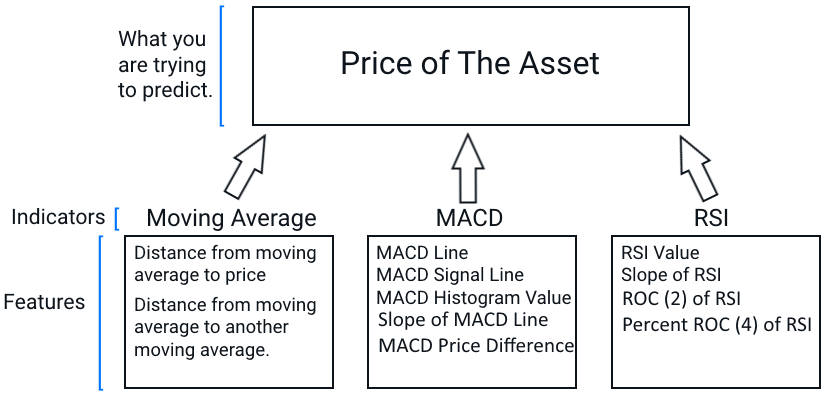
The indicators are “Moving Average”, “MACD” and “RSI”. The features are derived from the indicators. Sometimes, an indicator is a feature. For example the RSI’s output is just a number between 0 and 100, so it can be used as a feature. Other features could be derived from the indicator as well. For example, for a moving average, we could look at the distance of one moving average to another or the distance of the moving average to the price.
We already use features without thinking about it. When you are analyzing a chart and you bring up a 50-period EMA, you are not just looking at the value, or price, of the 50-period EMA, you are looking at the 50-period EMA and where it is relative to another moving average or the price or another feature.
In trading, there is an unlimited supply of features, especially in technical analysis. You want to select the features you are looking at based on your own experience. If you typically trade using the RSI, think about how you use it when you are looking at a chart, then create a feature that describes what you see.
Feature selection is generally overlooked but it is one of the most important aspects to data science and building a strategy. Here are some basic guidelines to feature selection:
Data science and machine learning are a natural fit for the capital markets. We have encountered some of the more overlooked aspects in the field are fortunate to have plenty of tools and resources to address these problems. When applying new techniques to your trading, you should always make sure you understand what is going into your strategy and evaluate, evaluate, evaluate.
You can select the indicators and features you want to analyze in TRAIDE. TRAIDE will then take care of the heavy lifting by using machine learning to analyze your data. Once you create a strategy on the Dashboard, you can automatically generate the code you need to evaluate your strategy on new data.
Click here to see for a video tutorial of TRAIDE.