

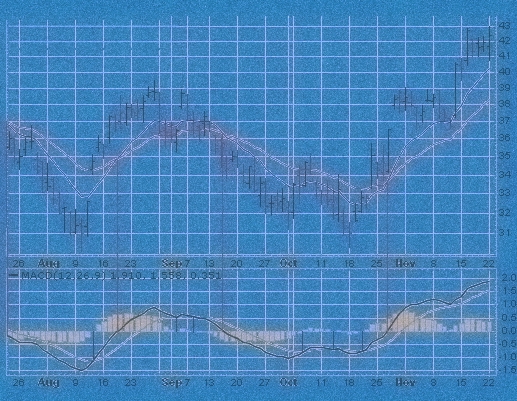
Moving Average Convergence Divergence (MACD) is one of the most popular technical indicators used by traders.
It is a flexible indicator that can be used for determining the strength and direction of a trend. It has three distinct features and in this first post we are going to do a high-level analysis of one of those features, the MACD Line.
We will compare three of the most common MACD Line settings on the EUR/USD using daily bars over the past few years to determine whether or not there is a historical pattern that can be exploited.
The MACD Line was the first feature developed in the MACD indicator. It was developed around 1977 by Gerald Appel. The other two features are the MACD Signal Line, a smoothed average of the MACD Line, and the MACD Histogram, which is the difference between the Signal Line and the MACD Line.

The MACD Line is composed of a fast and slow moving average. The value of the MACD Line is the difference between the two moving averages. The default settings for the two moving averages are typically 12-period (fast) and 26-period (slow) exponential moving averages and are generally calculated off of the close price of an asset. Using the MACD Line is the exact same as using a moving average cross. If you subtract the price of a fast-period moving average from the price of a slow-period moving average, you will get the value of the MACD Line. Gerald Appel also commonly uses default periods of 19- and 39-period EMAs while Tom Aspray, who added the histogram feature and studied the MACD in the 1980s commonly uses 10- and 20-period EMAs.
Gerald Appel claims, “As a general rule of thumb, the market climate is most unfavorable when the MACD is falling and below zero.” We’ll take the latter part of his rule of thumb to form our hypothesis; it is unfavorable to go long when the MACD Line is below 0 and it is unfavorable to go short when the MACD Line is above 0.
Using TRAIDE we can test exactly how favorable and unfavorable the market is when the MACD Line is above and below zero; We will try to find values of the MACD Line that lead to bullish and bearish moves the following day by looking at every trading day between August 1st, 2012 and March 24, 2015.
TRAIDE automatically generates a histogram of the empirical data to display the distribution of the MACD Line values over our date range. The histogram will show how many of the next days’ bars closed up and how many closed down for every MACD Line value over our date range.
To create the histogram, we will first select the asset we want to analyze, the timeframe and date range. We then select the MACD Line feature under the MACD indicator group in the middle column of TRAIDE’s Strategy Creation page. We can ignore the “Signal Moving Average Type” and “Signal Period” in the indicator settings because we are not using the MACD Signal feature.
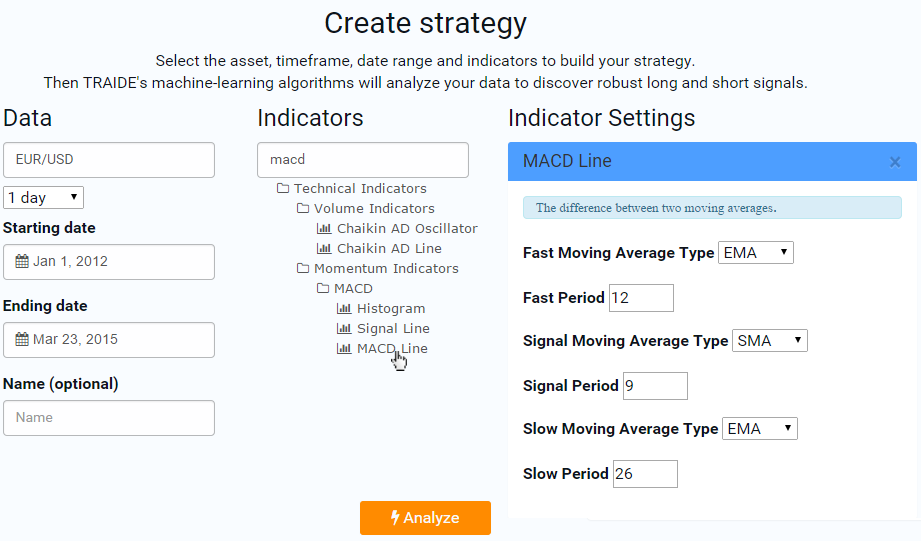
Let’s click analyze and look at the distribution.

Using our distribution, let’s test our hypothesis.
The first step is to remove the ambiguous information. The red and green bars in bin -0.002 (-20 pips) to 0.002 (20 pips) straddle the zero line; we don’t know whether the next day closed up or down since we cannot distinguish between the trades that occurred right around zero.
The next step is to click all of the green bars above 0.002 and all of the red bars below -0.002 and see what the accuracy is in our statistics table for each case. When we select the green bars, we are going long for all positive values of the MACD Line above 0.002 and going short for all negative values below -0.002. We want to see if just this simple rule will lead to over 50% of our trades being correct.
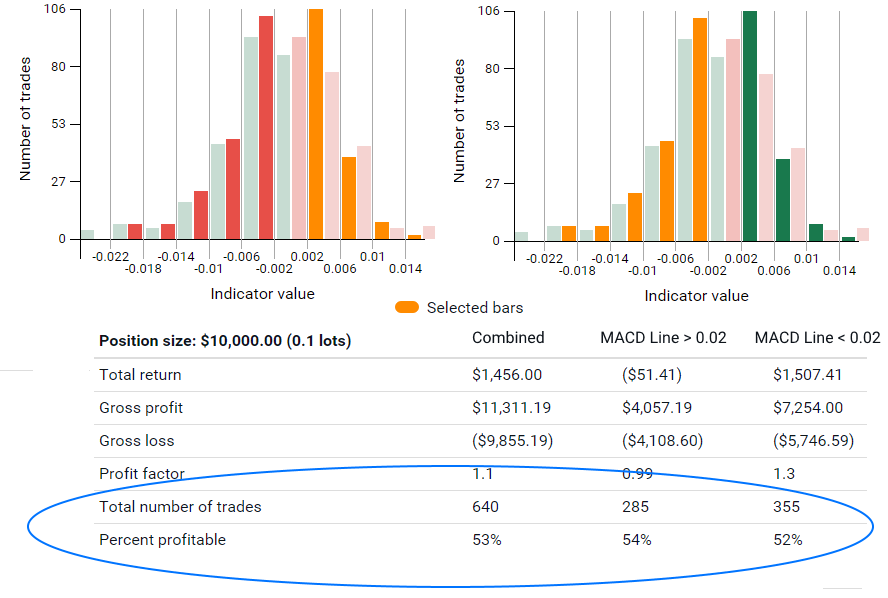
What we find is that when the MACD Line is positive, the price on the next day tends to close higher than the previous bar’s close and when the MACD Line is negative, the price on the following day tends to close below the current day’s close. There were 640 trades in our sample.
It turns out that our hypothesis is true. There is a historical pattern; when the MACD Line is negative (less than -0.002), the next day is bearish 52% of the time and presents an unfavorable condition to go long. When the MACD Line is positive (greater than 0.002), the next day is bullish 54% of the time, presenting an unfavorable condition for going short.
Let’s dive in a little bit deeper and see if we can refine our MACD Line values. From the distribution, it looks like the tail ends of the histograms don’t present a clear historical pattern while the histogram bars on either side of the -0.002 to 0.002 bin appear to have a clear pattern.
On the days where the MACD Line is greater than 0.002, but less than 0.006, the next day was bullish 58% of the time with 183 total trades. In other words, when the 12-period EMA is between 20 and 60 pips above the 26-period EMA the next day closed up 58% of the time. On the days where the MACD Line was less than -0.002 but greater than -0.006, the next day was bearish 52% of the time. We went from a sample size of 640 trades to 380.

You can use this information to not go long when the MACD Line is between 0.002 and 0.006 or if you are going long, check to see if the MACD Line is within that range. The same goes for going short but with the negative MACD Line values. You could also use this information for the basis of a strategy. Waiting for the MACD Line, with 12- and 26-period EMAs, to be between 0.002 and 0.006 would be a good first filter for going long. I would recommend adding a couple other indicators that you like using. Let’s take a look at the other commonly used settings.
Changing the defaults to use 19- and 39-period EMAs in TRAIDE:
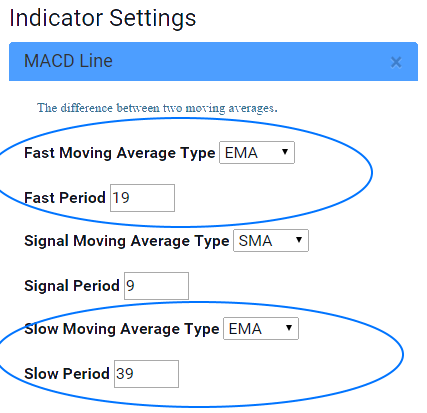
Once I hit analyze, the distribution will load on the Dashboard:
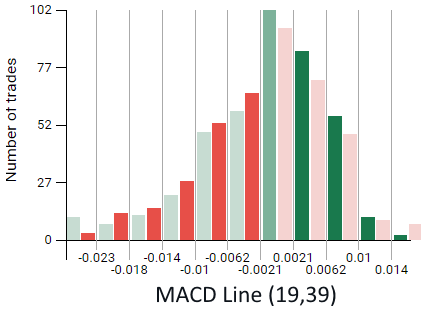
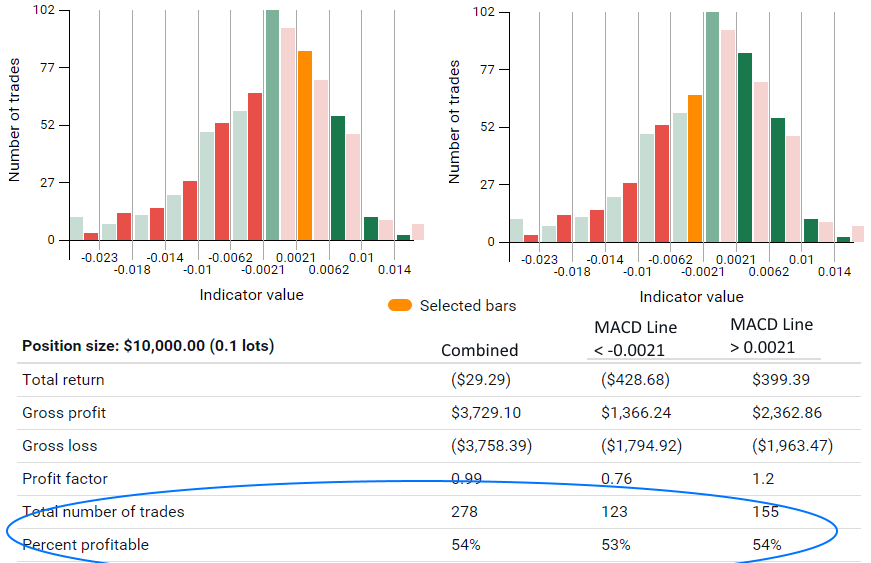
The two longer EMAs have caused a slight skew left. Let’s apply the same logic that we did in with the 12- and 26-period EMAs to do our analysis. Let’s remove the ambiguous data where the bin could be positive or negative. This takes out the bin -0.0021 to 0.0021. Then let’s select all the green bars to the right of 0.0021 and all the red bars to the left of -0.0021.

Again what we find is that our hypothesis holds to be true; when the MACD Line is positive (above 0.0021), the following day had a 53% chance of closing higher than the previous day’s close. When the MACD Line is negative, the EUR/USD had a 52% chance of closing lower than the previous day’s close.
Looking at the histogram, there appears to be a very similar pattern to our 12- and 26-period settings so let’s take a look and see if we can refine the MACD Line values.
If we click just the bars on either side of the -0.0021 to 0.0021 bin, we can see that 53% of the time, the following day closed lower than the previous day’s close when the MACD Line was negative (below -0.0021) while 54% of the time the next day’s close was higher than the previous day’s close when the MACD Line is positive (above 0.0021).
We found similar results, but the 12- and 26-period EMAs found a stronger pattern for going long, while the 19- and 39-period EMAs led to a slightly strong pattern for going short. Now let’s take a look at our final MACD Line settings; the 10 and 20-period EMAs.
We find something very similar when we use 10 and 20-period EMAs. 54% of the time, when the MACD Line is positive (above 0.0017) the following day closed above the previous day’s close. 52% of the time, when the MACD Line is negative (below -0.0017) the following day closed below the previous day’s close. Our sample size is 630.
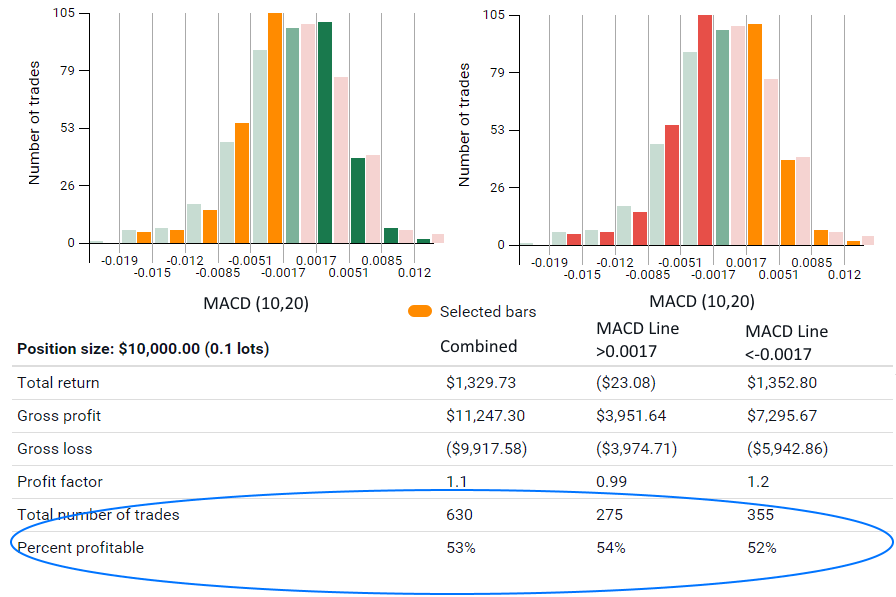
Applying the same process as the other two MACD Line parameters, we will see if the values that are just positive and just negative lead to a stronger historical pattern.
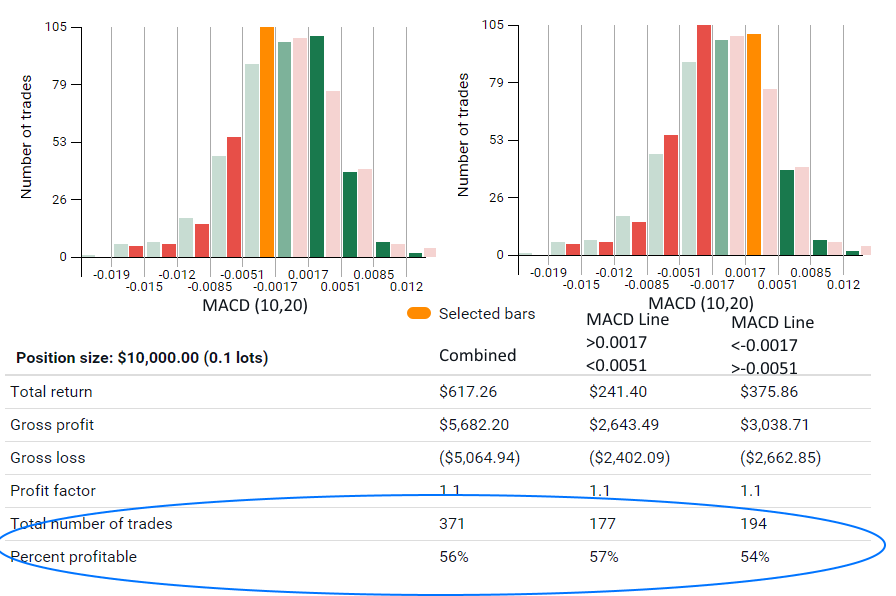
It appears so! Once again, selecting the bin to go short where the MACD Line is less than -0.0017 but greater than -0.0051 gave us 177 days where the following day closed lower than the previous day’s close 57% of the time. Selecting the bin to go long, where the MACD Line is greater than 0.0017 but less than 0.0051 gave us 194 days where the following day closed high than the previous day’s close. 54% of the time.
The MACD Line, using commonly used settings, is a reliable feature of the MACD indicator for determining whether or not it is favorable to go long or short on the EUR/USD using 1-day bars. I would suggest combining this feature with other indicators, using the MACD Line as a filter, or using it to confirm your trading decision. If you are applying this to other currency pairs or timeframes, make sure you study the MACD Line over those charts. Difference pairs and timeframes are going to behave in their own way.
A table of our results with the percent correct with each of the indicator settings:
| EMA: 12,26 | EMA: 19,39 | EMA: 10,20 | |
|---|---|---|---|
| MACD Line Positive | 54% Bullish | 53% Bullish | 54% Bullish |
| MACD Line Negative | 52% Bearish | 52% Bearish | 52% Bearish |
We can also conclude that the different period settings that we tested do not have a significant impact on whether or not the MACD Line can be used to determine whether or not the market is favorable or unfavorable for going long or short. What did have a significant impact was removing the tail ends of our histograms. Instead, when the MACD Line was just positive or just negative, our accuracy went of significantly for both long and short.
For all three indicator settings, it was better when we refined our parameters by selecting the bins where the MACD Line was just positive or just negative:
A table of our results with the percent correct with each of the indicator settings:
| EMA: 12,26 | EMA: 19,39 | EMA: 10,20 | |
|---|---|---|---|
| MACD Line Positive | 58% Bullish | 54% Bullish | 57% Bullish |
| MACD Line Negative | 52% Bearish | 53% Bearish | 54% Bearish |
It appears that the shorter EMAs, 10 and 20-period, returned the highest accuracy.
This high-level analysis on the empirical data of the EUR/USD using 1-day bars provides a good starting point for incorporating the MACD into your trading. The MACD Line is a reliable feature of the MACD indicator where we can find clear historical patterns.
You can generate these histograms in TRAIDE for any major currency on 1-hour, 4-hour, 6-hour, or 1-day bars since January 1st, 2012.