

Trading a moving average cross is one of the more popular techniques for building a technical analysis-based strategy. Conventional wisdom holds that when the shorter period moving average crosses above a longer period moving average there is a bullish trend, with the opposite conditions representing a bearish trend.
In this article, we will use TRAIDE to build a strategy that uses a moving average cross along with two other popular technical indicators, an RSI and ROC, for the AUD/USD on a 6 hour timeframe.
Every strategy starts with an underlying thesis, or idea, about how the market behaves. The beauty of TRAIDE is that instead of needing to painstakingly build and test that strategy yourself from scratch, we can use the data, indicators, and machine-learning algorithms provided by the platform for a much more efficient and robust strategy development process.
The first step is to choose your indicators. There are three considerations I use when selecting my indicators:
For this strategy, I am going to use a 20-period and 50-period EMA cross to find the direction of the trend, a 14-period RSI to find the intermediate trading range, and a 5-period ROC to look for breakouts and time the entries.
I will analyze 2 years data from January 1st, 2013 until January 1st, 2015, giving me plenty of data to build my strategy and 6 months left over for out-of-sample testing.
When I hit “Run”, TRAIDE’s machine-learning algorithms will find the relationship between my 3 indicators and the price movement of the AUD/USD on 6 hour charts.

Instantly I can see where TRAIDE’s algorithms found the strongest bullish (green) and bearish (red) signals.
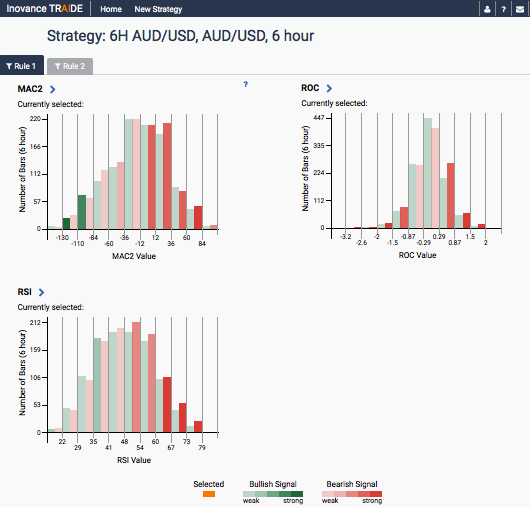
Now it’s just a matter of exploring the patterns until I am satisfied with the performance of my strategy. I will start by selecting the bars, or indicator ranges, that had the strongest signals and then build my strategy from there.
There are three things I look for when evaluating whether a strategy is worth trading:
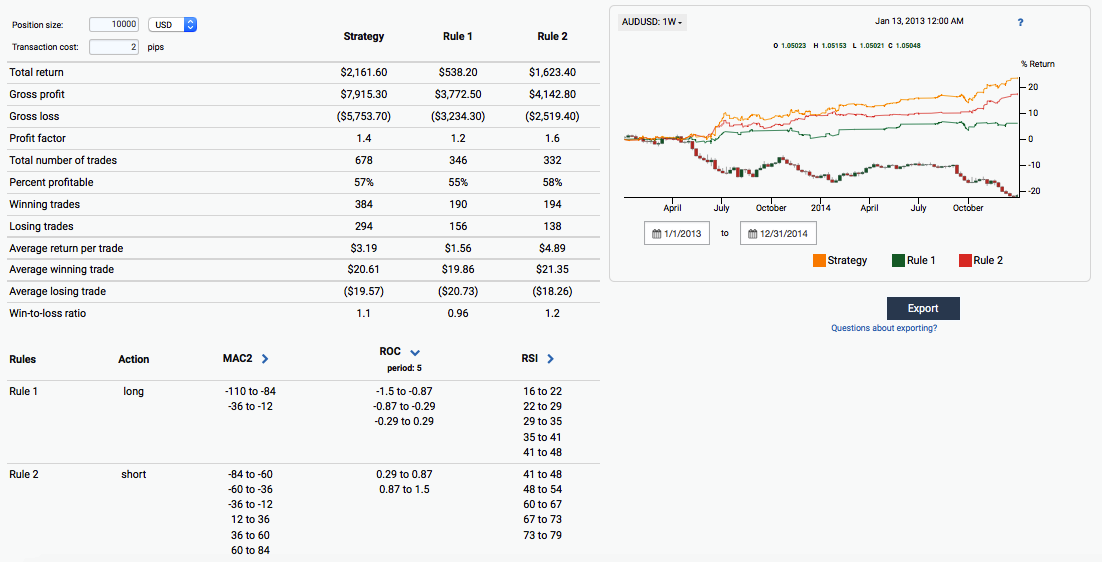
The equity curve and statistics show the performance of my strategy. TRAIDE assumes that you get in at the open of the bar and out at the close, so your holding period is effectively the timeframe, which in this case is 6 hours. Transaction costs are not included in consecutive trades of the same direction.
We can see from our long rules that we actually found a strong bullish signal when the shorter period SMA (50) crossed under the longer period SMA (200). This, in combination with a negative ROC and RSI values under 50, show that this is can be seen as a counter-trend strategy. The short rules are a little less clear but we can still see that we should go short when the 50-period SMA is above the 200-period SMA, the ROC is positive and RSI is over 40.
One of the most important steps is out-of-sample testing. This gives us an easy test to see if we are “overfitting” the data, or just memorizing the patterns for that particular date range instead of finding any real underlying patterns.
So I am going to export my strategy to MetaTrader4 (MT4) as a fully automated Expert Advisor (EA) and run my strategy over the last 6 months of data that was not used to build the strategy. I am looking for the performance statistics to be about the same to have the confidence I need to start trading live. (Here are instructions on how to export and test your strategy in MetaTrader4 and instructions on testing and running a strategy on 6 hour charts.)
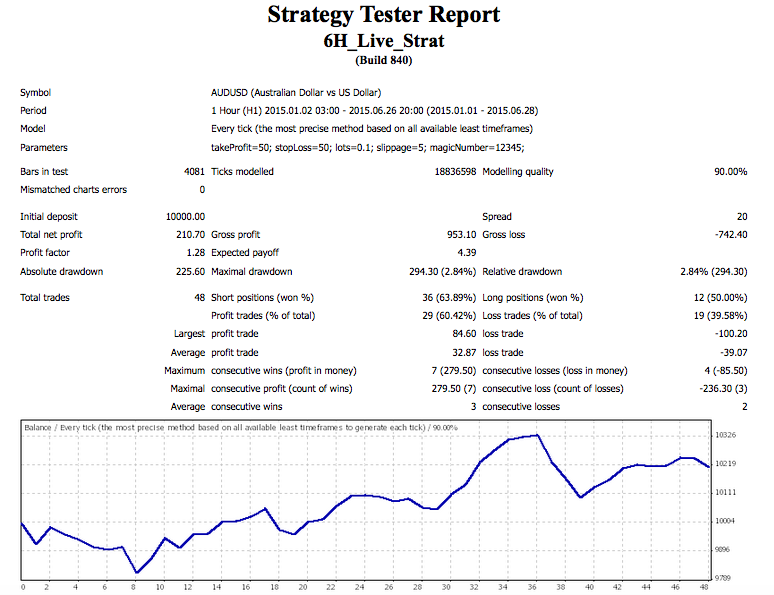
Wow! The return per trade actually went up (from $3.19 to $4.39), my accuracy improved (from 57% to over 60%), and it’s a fairly smooth upward trending equity curve! This is a great sign that we are on to something with this strategy!
I can now optimize my risk-to-reward ratio by adjusting the inputs to the EA.
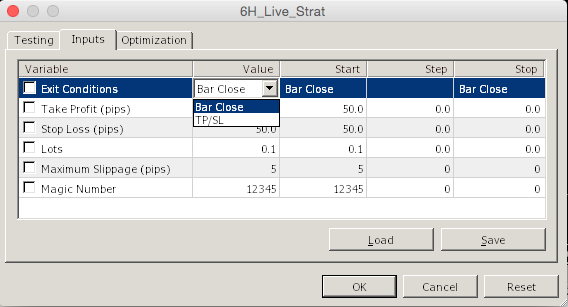
The default “Exit Conditions” of “Bar Close” will follow the same criteria of TRAIDE, i.e. enter at the open of a bar and exit at the close, unless the conditions are still met then the trade will remain open. “TP/SL” will still enter at the open of a bar but will include more traditional Take Profit and Stop Loss levels (in pips) that can be adjusted below. You are also able to set the position size, maximum slippage (in pips), as well as the Magic Number to keep track of your different strategies.
For this strategy, I will keep the “Bar Close” conditions and start trading it live! You can download this EA to use yourself here and here are instructions on testing and running a 6 hour strategy in MT4 and installing the TRAIDE-MT4 Indicators indicators.
Happy TRAIDING and can’t wait to hear about the strategies you are able to come up with!