

MetaTrader 4 (MT4) is by far the most popular fx trading platform, sitting on the desk of an estimated 40% of all retail fx traders.
While MetaTrader 4 does have some benefits, like a fairly flexible user interface, a custom built language, mql4, to build your own automated trading strategies (known as Expert Advisors, or EAs), and a large community of users, the main reason for its popularity comes from its low cost to brokers.
MetaTrader 4 can get the job done and many traders have used it successfully for years, but there are some quirks about the platform that you need to be aware of before trading live.
In this article, we will go over how to be sure your data is reliable, your indicators are calculated, and you are realistically accounting for transaction costs.

Making sure you are using clean, reliable data is one of the most important aspects to building a successful trading strategy. Unfortunately, this one area where MetaTrader 4 is sorely lacking.
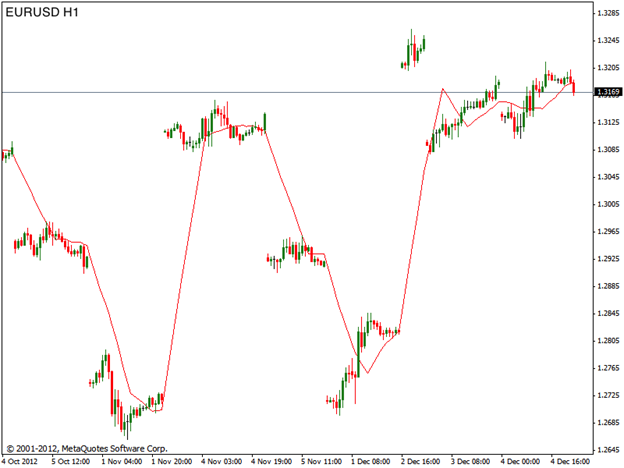
The first thing you need to know is that every time you open your MT4 terminal while connected to a broker, the data gets re-loaded. Data more than three months old is usually downloaded from the historical center while the more recent data is retrieved directly from your broker. This can lead to a number of issues ranging from holes and inaccuracies in the historical data, timestamps not matching up between data from your broker and the historical data, as well as slightly different data sets being loaded every time you open your terminal.
The easiest fix to this problem is to have a terminal specifically for backtesting that is disconnected from the broker and is loaded with high-quality historical data you can trust. You can download 1m data from FXCM directly from us for free. At the bottom of the page we provide a guide to setting up your MT4 terminals as well.
Another area where many traders get caught up is on the “Modeling Quality” measure in MT4 backtesting results and what that actually means. Many traders get caught up trying to reach that elusive 99.99% modelling quality, without understanding what that really means.
The formula used, which you can find here along with information on the other metrics on the strategy tester report, basically looks a measure of the “completeness” of the bars you are using in the backtest. If you build all of your bars off of 1-minute data, you get 90.00% modelling quality while 99% can only be achieved with tick data. However, a strategy built with 99% modeling quality isn’t necessarily more trustworthy than a strategy built on 50% modelling quality.
A strategy that trades daily, looks for more than 40 pips per trade, or is backtested over a huge amount of data with a much larger than average spread, is not as sensitive to the “completeness” of the bars as a much shorter period, scalping strategy.
As a general rule of thumb, any strategy built on timeframes longer than 1 hour will have no problem with using 1m bars. It really only becomes important to use tick data if you are looking to build a scalping strategy. Even then, finding reliable tick data that is consistent to the prices you will receive from your broker in live trading is very difficult.

Once you have the market data figured out, you need to make sure that your indicators are being calculated accurately. This is another area where MT4 could do a better job.
If you are using the default indicators (iRSI, iMACD, iSMA, etc.), you have to be sure you understand how they are being used. The built in RSI indicator variable looks like this:
double RSI = iRSI(NULL, 0 , 14, PRICE_OPEN, 0)
That all seems straightforward but you must be careful of the final two parameters, defined as the “applied price” and “shift” by the mql4 documentation.
Now let’s say you want to want to calculate your indicators off the close. Easy, right? Just change “PRICE_OPEN” to “PRICE_CLOSE”. Not so fast, since MT4 isn’t able to look into the future and know when the bar is going to close so it recalculates the indicator for every single tick (this is the same as the Close[ i ] command for a custom indicator). Now calculating the indicator off every tick could actually be what you want, but you need to be aware that this is what is actually happening.
A much bigger problem with MetaTrader 4’s indicators is the lack of transparency into what formulas are actually used to calculate the indicators. It is a fairly simple formula for a simple moving average or RSI, but once you start looking at even slightly more complex indicators like the CCI or stochastics, you run into some problems.
It turns out a lot of MT4’s native indicators are not calculated with what would be considered “industry” standards. This lack of transparency presents major issues anytime you are looking to take your strategy off the MT4 platform or even want to know exactly how the indicators you are using are calculated.
Now you could spend the time to code up every single indicator manually as a custom indicator but this requires the programming ability to build these indicators by hand, takes a huge amount of time, and opens the door for a huge number of possible user errors.
Luckily there are libraries, like TA LIB, that solve all these problems for us. TA LIB is an open-source technical analysis library that follows industry standard calculations and has a large, supportive community. Currently, there are not any trustworthy MT4-TA LIB bridges available, but Inovance will soon be providing this functionality to users, giving you access to the trustworthy, transparent, and robust indicators that you need to be successful.

Once you have your data and indicators set, you need to figure out how to accurately model your transaction costs, meaning slippage and spread. It seems like a straightforward process of just setting the spread equal to 3 in the Strategy Backtester settings.
Not so fast. To start, for all 5-digit brokers (meaning most brokers), the spread in the Strategy Backtester settings is actually in fractions of a pip, not pips. So setting the spread equal to 3 is actually a spread of 0.3 pips instead of 3 pips. To set a 3 pip spread with a 5-digit broker, you need to set the backtesting spread to 30. This makes a huge difference and must be accounted for if you are going to trust your backtesting results.
It is important to note that setting the spread to “Current” just uses the last available spread. This can vary wildly, so you must keep an eye on this especially if you are testing over the weekends which uses the last recorded spread of Friday afternoon.
Your trading cost is is the sum of the spread and commissions that your broker charges. MT4 does not allow you to input commissions into your backtests so you will need to add this cost to your spread.
Brokers love to advertise their low “average” spreads but these can be very misleading. While in times of low volatility, when there are not very many orders are being placed, spreads are generally less than 2 pips on major currency pairs. However, with any large market move these spreads can jump up to 10, 20, or even 30 pips.
You need to know what the transaction costs are going to be like when your strategy trades on a live account. Some brokers will feed their demo accounts with low spreads that you won’t see in your live account. By analyzing the trading costs of your strategy on a live account with either very small position sizes (mirco lots), low leverage, or on an account with a small deposit, you have a low risk way of accurately measuring your trading costs when you go live.
When used correctly MetaTrader 4 is a powerful platform, but there are issues that must be understood and addressed before you can trust your strategy on a live account.
TRAIDE now supports the ability to export your strategy directly to MetaTrader 4 as an Expert Advisor so you can leverage TRAIDE’s machine-learning algorithms to build your strategy and MetaTrader 4’s backtesting and live trading to capitalize on your strategy!
Happy TRAIDING!