

Creating a trading strategy is only the first step to trading successfully.
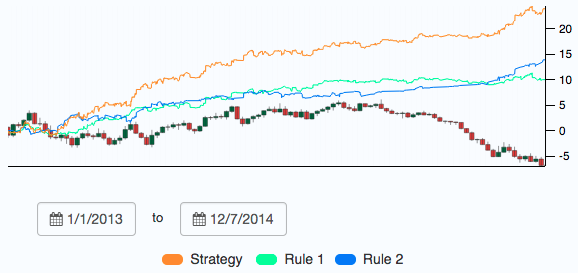
You must then evaluate its performance and decide if you can trust it on a live account. While so much attention gets paid to coming up with a strategy, there is surprisingly little on how to tell if the strategy is any good. Most traders take a look at the net profit, some risk-adjusted metric like the Sharpe ratio, the max drawdown, overall accuracy and, if the equity curve looks fairly smooth, it’s good to go!
However, this can be a naive approach that ignores many important aspects: Am I just overfitting the data? Exactly how risky is this strategy? Are these results statistically significant? Under what market conditions did my strategy perform poorly? If I do trade it on a demo account, how long should I wait before going live?
These are just a few of the questions you need to be asking yourself with every strategy you are considering trading live.
We’ll try to answer these questions, and more, to give ourselves more confidence in the strategies we trade live. We’ll break down the strategy’s performance into 5 categories: Profitability, Risk, Statistical Significance, Stability, and Live Performance.
This article will cover the first 2 categories, Profitability and Risk, as it pertains to an fx-based strategy.

Profitability is the first thing most traders look at but answering the question “how profitable was my strategy?” is a surprisingly difficult question to answer. Saying it returned 20% doesn’t tell you much.
Was it 20% before or after trading costs? What type of drawdowns did you have to go through to get that 20% return? Over how long of a period did it take? If it was annualized, did you make 120% 6 years ago and nothing since?
When measuring profitability, there are a couple of important things to remember:

Measuring your risk is a well-documented but much more difficult and misunderstood topic than profitability. Especially in light of the recent Swiss National Bank’s (SNB) actions and “Francogeddon”(or the “SNBomb” depending on your sources), the importance of understanding market risk, liquidity risk, and counterparty (broker) risk becomes all the more apparent.
Market Risk
Market risk, or the risk of losses coming from movements in market prices, is the most obvious one to traders. While the easy answer is to “always use stop losses” that is only part of the solution.
One area that is often overlooked by more active traders is the benefits of trading a diversified portfolio of strategies. Trading uncorrelated strategies is a great way to decrease your market risk and when evaluating any strategy, you must look at how it fits in with your other existing strategies.
If you had been long the EUR/CHF and short the USD/CHF you would have felt a lot better waking up to the news of the 2,000 pip move.
Liquidity Risk
Liquidity risk is much trickier and isn’t something you usually have to worry about in the most liquid market in the world but once again the recent SNB move showed why this is important as many traders were not able to exit their positions during the free fall. There isn’t a sure-fire way to guarantee you’ll be able to get out of a trade but there are a couple things you can do to decrease your risk.
Counterparty Risk
The importance of understanding counterparty risk, or the risk that your broker will no longer be in business when you go withdraw your money, once again become abundantly clear with the trouble of many fx brokers, including Alpari going bankrupt and FXCM’s much publicized troubles.
Hugh Kimura at TradingHeroes wrote a great article on avoiding broker risk that includes keeping a majority of your trading in a 3rd-party bank, withdrawing your trading profits, and opening accounts with multiple brokers.
One benefit of this most recent crisis is it gave us a good look into which brokers have a solid financial base and were able to withstand heavy losses. Moving forward it is a safer bet to trust your money with these brokers over others that may have had trouble.
Understanding the profitability and risk is only the first part of trusting your strategy to trade live. In the next post we’ll go over how to measure the statistical significance and stability of your strategy as well as how to know when it has fallen out of sync with the market during live trading.
How do you account for profitability, risk, and statistical significance in your trading?
Be sure to check out TRAIDE to build your next strategy using machine learning!